Study on gold implantation in humans
Ackermann Team and Dr. Melanie Endrizzi
In 2016, the society for gold implantation for joint treatment and pain therapy started a retrospective observational study in cooperation with the surgeon Dr. Melanie Endrizzi. Patients who have obtained a gold implantation according to Dr. Kjerkegaard®’s method since 2015 were interviewed by telephone.
The first interim results were presented at the 52nd Medizinische Woche Baden-Baden – Ärztekongress für Komplementärmedizin* (Baden-Baden Medical Week – Physicians’ Congress for Complementary Medicine). 114 patients with 135 treated joints were interviewed with respect to their health, analgesics required and above all the intensity of their pain on a scale (VAS = “visual analogue scale”) from zero to ten (0 = no pain, 1 = just noticeable, … 10 = unbearable). Each dot in the following charts corresponds to a pain score obtained from a patient. Scores at rest and under strain were recorded at different points in time.
The outcome: for about 2/3 of the patients interviewed the pain value decreased significantly after gold implantation!
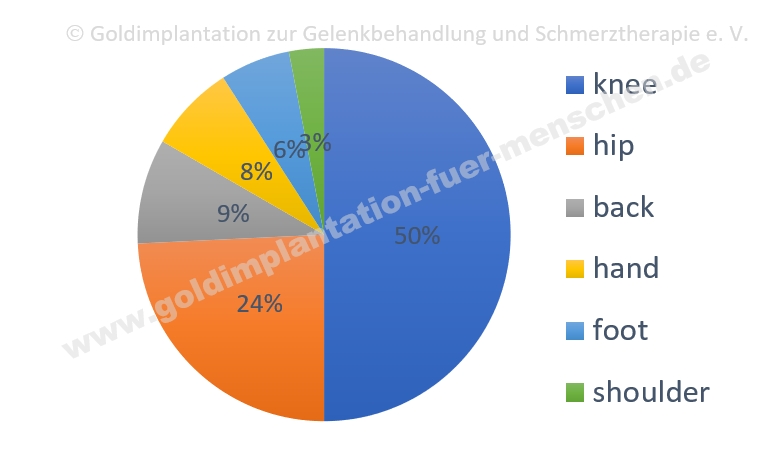
Interviewed patients’ joints |
|
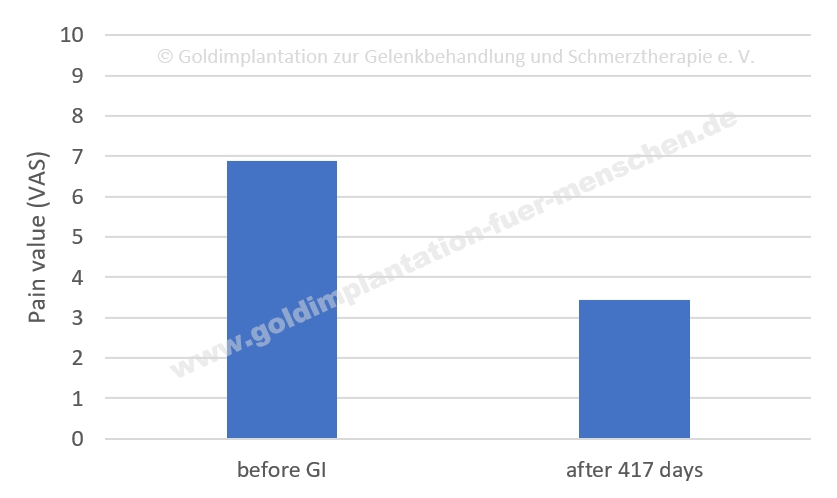
Pain scores (VAS) reported by the patients before gold implantation and at the time of the interview (average scores across all patients and joints) |
|

Patients with significant reduction of pain after gold implantation: pain scores before gold implantation and at the time of the interview as well as moving average** |
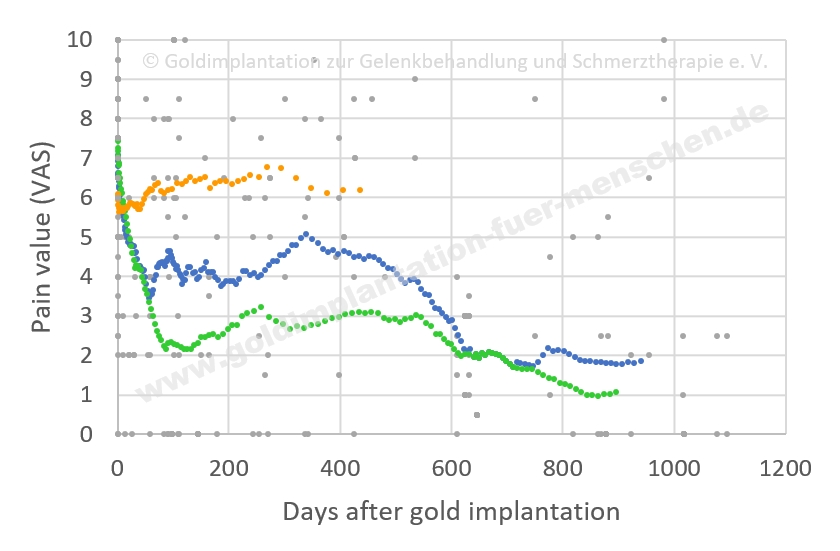
Patients with gold implantation in |
|
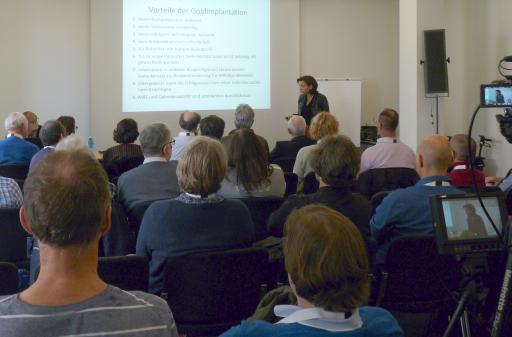
Baden-Baden in 2018, |
|
|
Meanwhile (as of autumn 2019) 200 patients with 230 joints have been interviewed with respect to their pain value. The results confirm the 2018 ones. (Please also see our flyer .)
|
|
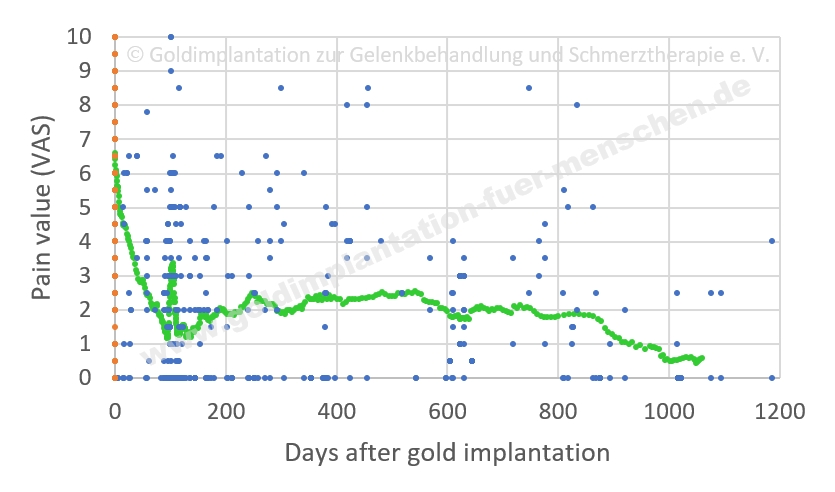
Patients with significant reduction of pain after gold implantation: pain scores before gold implantation and at the time of the interview as well as moving average** (as of autumn 2019) |
|
* Melanie Endrizzi: Goldimplantation – Eine alternative Therapie bei Gelenkschmerzen/Goldimplantation als alternatives Verfahren zur Schmerzbehandlung von Gelenken mit Arthrosezeichen (Gold implantation – An alternative therapy in case of joint pains/Gold implantation as an alternative method for treating joints pain with signs of osteoarthritis). 52. Medizinische Woche Baden-Baden – Ärztekongress für Komplementärmedizin (52nd Baden-Baden Medical Week– Physicians’ Congress for Complementary Medicine), 31 Oct. – 4 Nov. 2018, Klinische Session „Schulterschmerz“ (clinical session “shoulder pain”), 3 Nov. 2018. (In cooperation with the society “Goldimplantation zur Gelenkbehandlung und Schmerztherapie e. V.” (gold implantation for joint treatment and pain therapy, registered society).)
** The moving average is computed as follows. The scores on a pain scale obtained from the patients are available at varying points in time (a differing number of days after gold implantation). The data (points in time and pain score couples) is arranged in temporal order according to the number of days after the gold implantation (from low at the beginning, to high at the end of the series). Then for the first n data (e.g. n = 40) the average of the number of days and the average of the pain scores are calculated. The result is plotted in the diagram as one green dot. Now the first of the n data is omitted and the next one added, and the average is again calculated. The result is likewise plotted in the diagram as another dot. This process is continued until the last position in the series is reached and all values have been plotted. (The “window” of n data is thus “moved” along the data series, hence the name of the “moving average”.)
The descending series of green dots, which appear like a curve, thus means, put carefully: the farther away the time of the interview is from the day of the gold implantation, the lower the pain score on average is reported by the patients. A patient’s data is often available for only two or three dates, which vary among patients. The interviews will be continued in order to obtain data at further points in time. In large-scale scientific studies patients could be interviewed at identical times, e.g. 3, 6, 9, 12 and 24 months after the gold implantation, so that calculating the average would be possible at identical points in time. If this revealed the same tendency as the moving average “curve”, then the statement could be made that the patients’ pain scores decrease over time. Interpreted cautiously, the above moving average can only be understood as an indicator of this.
Text and diagrams: Dietmar Hepper, Goldimplantation zur Gelenkbehandlung und Schmerztherapie e. V. – Ackermann Team

